Issue 5
Quantifying Social License Through the Social License Graph (SLG)
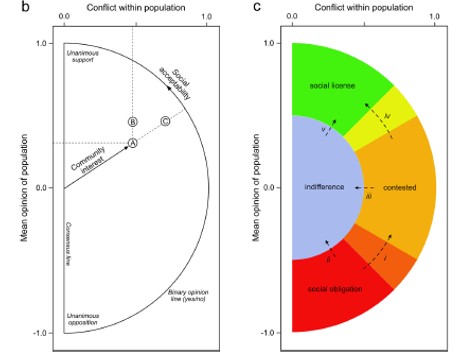
In April 2025, researchers unveiled a new quantitative tool—the Social License Graph (SLG)—that aims to transform how public acceptance of projects and policies is measured. Published in Nature Humanities and Social Sciences Communications, the SLG offers a structured method to assess the Social License to Operate (SLO), traditionally seen as a qualitative, perception-based concept. The framework draws from community survey data, using two key indicators: the average opinion score, reflecting general sentiment, and the standard deviation, indicating the degree of consensus or division. These metrics are then plotted on a complex plane, with the point’s angle representing social acceptability and its distance from the center reflecting engagement intensity. This visual model enables comparisons across projects, tracks changes over time, and helps policymakers and companies understand not just what communities think, but how strongly and unanimously they feel about it. The SLG has potential to bridge communication gaps and guide more responsive governance and stakeholder strategies.